One of the diagnostics tools available at the StayLinked Server is the Statistics Log. This log may be enabled when more information is needed regarding network transactions, server performance and transaction footprint. This log file is not enabled by default. The contents of this file can help provide an understanding of the transaction type, size, frequency and reliability. This is commonly recommended when transactions are experiencing performance delays or when a deeper understanding of the transaction patterns are required.
Log File Contents
The stats include the date, time, session number, device IP address, device MAC address, summary line, list of blacklisted ports, and session specific values including:
| PSNT | Packets Sent | (packets sent from the server to the client) |
| PRCV | Packets Received | (packets sent from the client to the server) |
| KBSNT | Kilobytes Sent | (data size of packets sent from the server to the device) |
| KBRCV | Kilobytes Received | (data size of packets received from the device) |
| OOS | Out of Sequence | (packets that arrived at the server out of order) |
| RTX | Retransmit | (packets that had to be resent to the device) |
| DUP | Duplicate | (packets received more than once) |
| SOK | Synchronization | (the client and server confirm that they are synchronized) |
| AGD | Aged Syncs | (multiple synchronizations in the receive buffer) |
| TXF | Transmit Buffer Full | (number of times packets overflowed the send queue) |
| RCO | Reconnect | (number of times a device reconnected to an existing session) |
| KEY | Keystrokes | (number of key presses from the device) |
| SCN | Scans | (number of scans from the device) |
| CMD | Commands | (number of on-screen SmartTE buttons used) |
Blacklisted ports are ports on which a handshake has failed. They will be skipped for use until more ports are required, which will clear the blacklist and start over.
Note that a keyboard event is used to lookup a reference in the keyboard map. On-screen SmartTE buttons mapped to the [key=XXXXXX] as well as on-screen keyboard and hardware keyboard buttons trigger these transaction types. Using SmartTiles, extended keys, tap spots, or designer buttons that directly type data will be recorded as commands. For example, a SmartTiles customer keyboard mapped to W would be a command, unless it is mapped to [key=005700] which would be the same result, but submitted as a keyboard input.
Setting a Statistics Interval
Statistics logging is enabled in the Usage Tracking features of the Administrator. After selecting usage tracking, double click the statistics tracking option and answer yes.
Once enabled, more options will appear. These include:
- Statistics Reporting Interval – Time between reporting periods. Sessions that begin and end between reporting intervals will not be recorded.
- Statistics Log File Maximum Size – Set the size of the statistics log file. A file that hits this size will be copied out and a new file will be created. Current StayLinked versions keep the last 10 copies of this file with date and time stamps in the file name. This log will not have a significant effect on storage requirements of the StayLinked Server, since it creates only one log at a time for the entire Server.
- Statistics Log File Session Counts Only – Disables the individual statistics for each session and provides a count of active sessions at each reporting interval.
Starting in Server version 15.1, the Server Statistics log file is enabled with a 60 minute interval by default on new installations.
The typical recommendation is a reporting interval of 60 minutes. When this feature is enabled, the first dump of statistics will include all stored data since the server process was started. This typically invalidates the first data set, unless the server was recently started.
Performance Indicators
One of the keys to reviewing this log file is that the numbers are only relevant in context. For example, turning on the log during an issue will not provide a comparison of statistics during normal operation. If the log shows a high number of retransmits, out of sequence or aged syncs, it may be reporting perfectly normal operating numbers. The counts of columns do not automatically indicate a performance issue since it does not account for the user experience.
PSNT vs PRCV – In an average environment, the number of packets sent from the server to the device will be about 2-4 times the number of packets receive from the device, while the size of those packets will be significantly larger outbound than inbound. This is because most applications will show more information on the screen that the user provides back to the host. For example, the host may paint a menu with multiple options, and the user would submit a simple number or letter and the enter to confirm their choice.
RCO – In some environments, reconnects can be a simple measure of user frustration levels. Users often reboot devices when they misbehave, so high numbers can reflect issues. Some devices will show reconnects on battery swaps or network changes, so your environment may show additional numbers for this type of event.
Example File Contents and Review
The following section of a stats log has been sorted by IP address. For the purposes of spacing, date and time, session ID, device MAC addresses, and dormant sessions have been removed from these examples.
In this example, the only entry of note is the session listing 171 transmit buffer full packets. These are transactions that are being queued up by the Server. If these were taking place across the entire range, it might indicate that the entire Server is having delays in getting outbound packets confirmed. Since it is affecting only a single device, it’s most likely an issue with that one device.
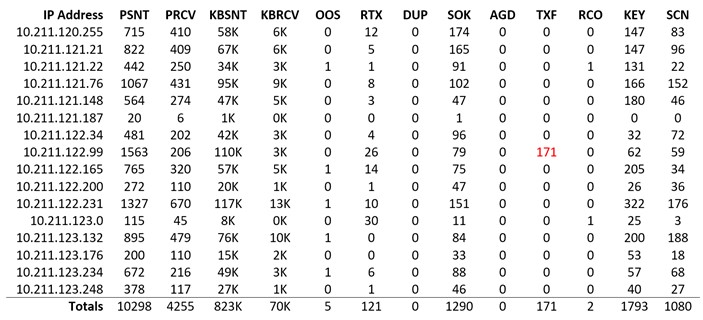
An example of context – Assume this log is configured for a one hour reporting interval. It’s entirely possible that this device was the only device performing transactions during a brief interruption in network communications and server processing load. This means that the issue may possibly still be server-wide, since it only affected the one worker who was operating a device. Had this been the only device in a specific subnet, it could also indicate issues with that specific network segment.
Single results like this make it hard to draw conclusions. Gathering statistics over time can help provide a baseline for review. Please note that all statistical review has been completed in Microsoft Excel and is not part of the statistics logging features.
In this example, we’ve taken the number of retransmitted packets and divided by the total packets sent for each device. This allows an easy review of high-retransmits per device. Just viewing the retransmits would provide only part of the picture, since a retransmit number only provides information when viewed in the context of total packets.
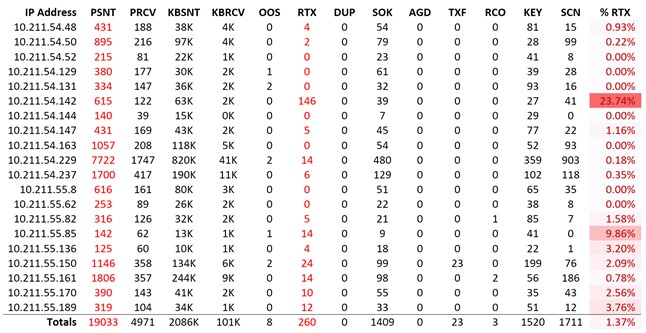
As with the previous example, these users may not be aware of any packet delivery issues. Missing every 4th packet might be completely invisible to the affected user. It’s also possible that the user was unable to move any data across the network for 14 minutes of this one hour period. Trying to operating a device for 14 minutes without success would be very frustrating to any user.
Gathering more information about the time of day, type of device and work location may also provide information that leads to specific access points, device firmware, or specifications.
This last example shows multiple challenges. The first thing that may stand out is that there are no scans. If the users do not use an integrated scanner, then this is perfectly normal. If the users do have a scanner, then they are either not using it or the devices may not be properly configured. Generic clients or devices with tethered scanners typically require scanner-as-wedge configuration. More information on scanner-as-wedge can be found in the technical reference article of the same name.
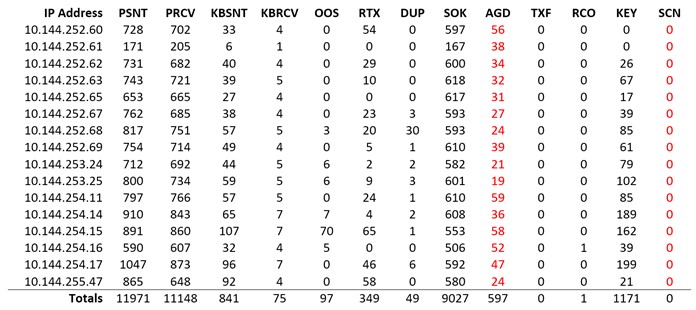
The second indication that something might be amiss is the aged sync counts. Aged syncs happen when the StayLinked Server process reviews the socket and finds more than one synchronization request. The synchronizations are typically timed for two second intervals, meaning they will only get stacked up when they arrive together, or are waiting for processing time before the socket can be serviced. Either way, it means that transactions are being delayed before processing. This log also shows a high number of packets received to packets transmitted. This indicates that the devices are probably sending their data repeatedly since they do not hear back from the Server in a timely manner. More information on server resources can be found in the StayLinkedManager.log file and several technical reference articles.
Packets sent are typically higher than packets received, since the server must paint each screen update while the client only sends input events from the user.
Instructional Video: How to Turn on Statistics Logging
Summary
All of these details help show that this log file can be invaluable when diagnosing an issue. Reviewing this file without issues can help establish a baseline for typical numbers. This log can also be important when attempting to establish the range of an issue. It is not uncommon for customers to contact our support team about a site having issues, only to find that every site was affected by a network interruption but only one site would discuss the issue with supervisors or support staff.
It is always important that detailed notes are made when any issue is reported. StayLinked messages are specifically designed to point troubleshooting efforts directly to the possible sources.
Share the post "Statistics Logging"